From Cornwall Insight Australia’s NEM Market Analysis report
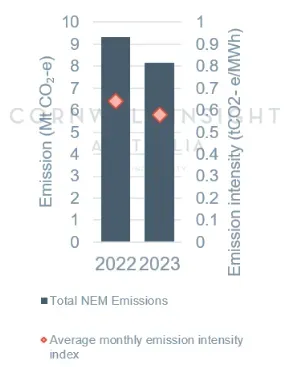
This October saw a 12.6% reduction in total emissions (accounting for -1.18 Mt CO2-e reduction) as solar and wind generation has increased significantly. The reduction in emissions may continue with the arrival of Fly Creek and Rye Park wind farms expected soon in NSW. This emissions intensity index drop was 9.7%, a significant number, as increases in rooftop PV decreased grid demand (and thus generation).
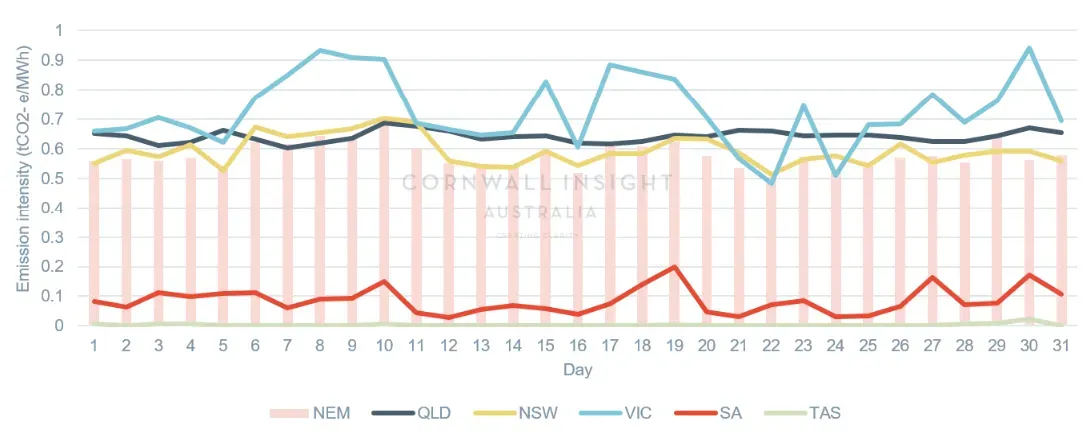
With wind droughts common, the daily pattern saw some shifts, with emissions notably increasing on a handful of days as SA’s emissions became visible. Victoria saw an output increase, which was largely exported to NSW on the majority of these uptick days. This is seen in the daily emission chart below. A similar pattern was also observed in the last week of the month.
Figure 1: Annual comparison between total monthly emission and emission intensity index 2022-2023

Figure 2: Total daily emission per state and NEM total

Figure 3: Daily emission intensity per state

Source: NEMWEB, Cornwall Insight Australia
The NEM market analysis by Cornwall Insight Australia is a monthly report containing key market data and analysis as well as important market developments, including daily emission indices by state.


