Cornwall Insight Australia recently launched our Marginal loss factor (MLF) curve subscription insight service.
The MLF curve provides future projections of MLF throughout the NEM, allowing clients to be better informed of likely MLF trajectories for both current projects and be able to benchmark MLFs for projects under development. The MLF curve includes projections for all current generators in the NEM and selected TNI points in Renewable Energy Zones (i.e., sub-regional REZ locations).
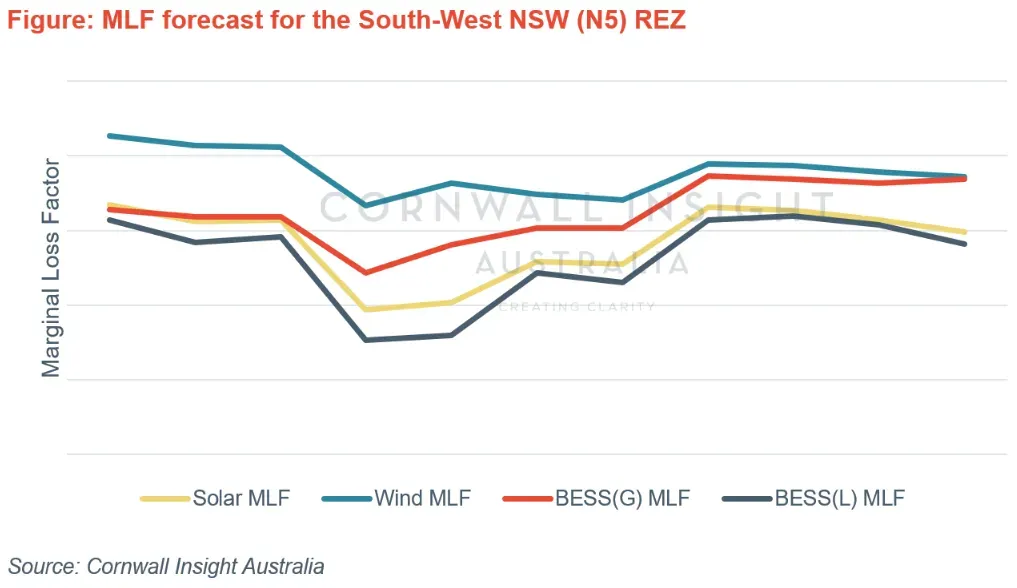
Below are two redacted charts from the report of the MLF forecast and TOD average loss factors for the South-West NSW (N5) REZ.


In this REZ, generators in the South-West section of New South Wales have lower MLF values due to increased power flow from the area’s connection point. This is caused by excessive localised generation combined with a troubled path to the load centre, leading to generator output travelling towards the RRN. System strength and reliability challenges have also impacted outcomes due to inverter-based resources.
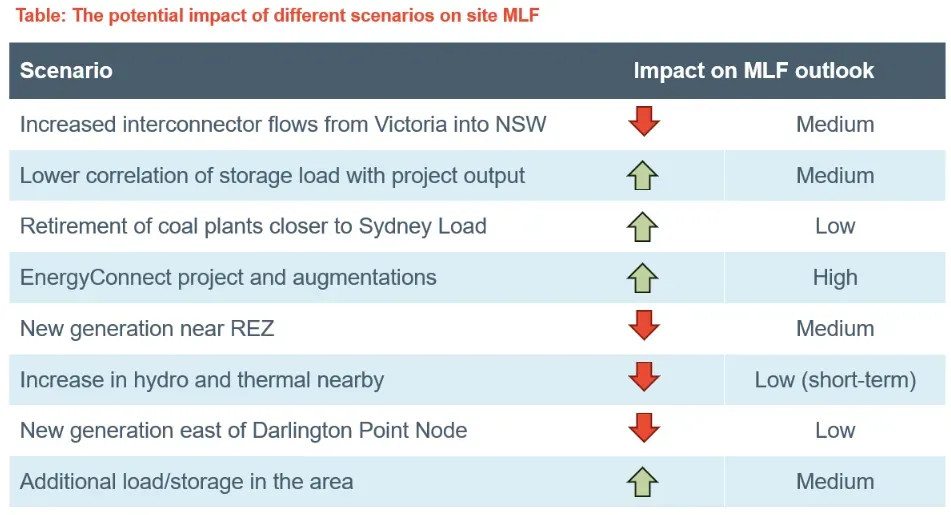
Below is an excerpt of the potential impact of different scenarios on site MLF for the South-West NSW (N5) REZ.

Below is an excerpt of the investor assessment on South-West NSW (N5) REZ buildout capacity.
Investor assessment on South-West NSW (N5) REZ buildout capacity (excerpt)
- Area a dead zone for generation in the short term due to system curtailment, increased economic curtailment and reducing marginal loss factors
- These constraints are somewhat alleviated with EnergyConnect comes online, although risks arise from transmission upgrades stopping at Wagga Wagga and reduced flow when TUMUT3 operates
- Due to poor MLFs and high economic curtailment for solar in this region, and peak time competition potentially reducing upside for wind and storage, it is recommended that the area be approached carefully
- Storage assets pose the highest value with potential looming curtailment markets. However, solar and wind will likely need more certainty around the future of the Snowy 2.0 rollout to see further upside
- Network curtailment is forecast to decrease significantly once all four transmission upgrades are complete (EnergyConnect, Snowy, Humelink + South-West stability upgrades). The timing of these upgrades needs to be weighed against the increasing levels of self-curtailment by VRE projects in NSW due to rooftop PV, with an additional downside risk of lower than typical MLFs given the proximity to other generators towards the node.
The report contains quarterly analysis of specific REZ zones including sit location and project details, MLF profile, factors that impact the MLF forecast, and investor assessment on REZ buildout capacity.
We can send you a copy if you’re interested in receiving a sample of the MLF curve.


