As the grid transitions to much higher levels of renewable penetration, the range of generation outcomes on any given day increases. The worst of these ranges are known as dark doldrums when there is a combination of poor conditions for wind and solar generation, usually a windless day in winter. However, the statement ‘it’s always windy or sunny somewhere in the NEM’ suggests that the NEM as a whole can generate clean energy, and the missing piece of the puzzle is to build more transmission interconnection between the region suffering a dark doldrum period and the wider NEM.
This Chart of the week is focused on Renewable Energy Zones (REZs) capacity factors when Victoria experiences very poor variable renewable energy (VRE) generation from a dark doldrum event. To conduct this analysis, the wind and solar trace data from the AEMO 2023 ESOO model was used to calculate the capacity factor of every day for each reference year (2011-2023), sorting by Victoria and the days which capacity factor fell into the bottom 10%.
This dataset contained the daily capacity factors for VRE generation in Victoria during the dark doldrums[1]. The next step was to calculate each mainland neighbouring REZ capacity factor on these days.
To answer yes to the question Will interconnection and transmission save us on bad VRE days?”, we would need to see REZ zones with a capacity factor that is significantly high to justify the capex of building more interconnection.

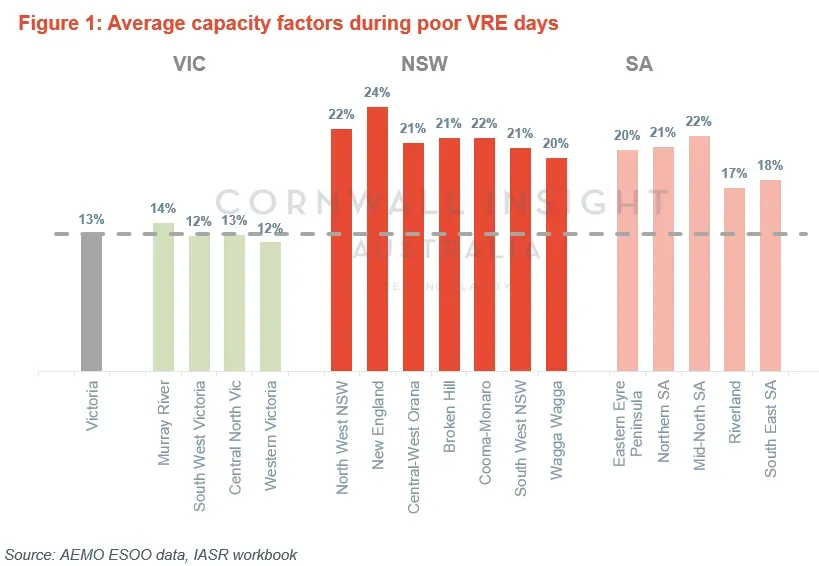
Figure 1 shows the capacity for Victoria during the worst 10% VRE days, along with each neighbouring REZ zone capacity factor. NSW REZs are sorted from north to south, and SA REZs are sorted West to East. Very poor VRE in Victoria tends to occur most often on a windless day in winter, so the further you locate the asset away from Victoria, there is a probability that the weather will be more favourable at the second location and, thus, better VRE generation. Figure 1 supports this as the rankings of REZ mostly follow their position on a map from north to south, with the New England REZ performing the best during Victoria’s dark doldrums.
This incentive to increase interconnection to capture more of the capacity factor that New England offers must be weighed against the build cost, social license issues and supply chain constraints that are a problem for many current interconnector projects (VNI WEST, Marinus link). The alternative is ‘overbuilding’ Victorian REZ generation, building more long-duration storage assets or face the risk of coal closure dates being extended and more gas peaking capacity.
As the grid transitions to much higher levels of renewable penetration, the number of possible pitfalls when evaluating energy projects increases. Cornwall Insight Australia has NEM market models based on market-validated assumptions and sound power systems principles. For more information on the energy market and power systems modelling or other bespoke consultancy products, please contact enquiries@cornwall-insight.com.au.
Appendix:
- Using 2023 ESOO, the dataset contained 4758 days of daily capacity factors in Victoria for solar and winter from 13 reference years, then the 10% of days with the lowest capacity factors were matched by other REZs on that day from that reference year.
- REZ that contain both wind and solar are going to be skewed by the ratio of wind to solar as wind has a higher average CF. The following table contains contains the data shown in figure 1 if separated for wind and solar.
| Average CF 12.65% | Solar only | Wind only |
|---|---|---|
| Murray River | 13.67% | N/A |
| South West Victoria | N/A | 11.77% |
| Central North Victoria | 13.49% | N/A |
| Western Victoria | N/A | 11.26% |
| North West NSW | 22.34% | N/A |
| New England | 21.02% | 29.52% |
| Central-West Orana | 18.91% | 28.85% |
| Broken Hill | 18.99% | 28.99% |
| Cooma-Monaro | N/A | 27.62% |
| South West NSW | 18.24% | N/A |
| Wagga Wagga | 17.57% | N/A |
| Mid-North SA | N/A | 21.75% |
| Northern SA | 19.42% | 20.89% |
| Eastern Eyre Peninsula | N/A | 20.52% |
| South East SA | 15.05% | N/A |
| Riverland | 13.67% | 18.11% |
[1] The average capacity factor for each REZ includes both solar and wind traces, so is also influenced by the number of wind traces relative to solar. More information on the breakdown between solar and wind capacity factors is available at the end of the article.


