The Australia-Asia power line proposed by Sun Cable will connect a 17-20GW capacity solar plant to Darwin with an 800km High Voltage Direct Current (HVDC) transmission line, which then connects to Singapore via a 4,500km HVDC transmission subsea cable (Australia-Asia-powerlink). Expected to be operational by 2027, the $35 billion project has not been smooth sailing, with administration issues that put the project’s future in doubt. With these problems now behind them, another problem occurs when taking a closer look at the project on a map – Singapore is 1 hour and 30 minutes behind Darwin, and thus Singapore’s peak afternoon demands and Darwin’s peak solar generation do not occur at the same time. Developers plan to offset this problem with a massive 3600-4200MWh battery which will be installed to transmit power to Singapore at optimal times.
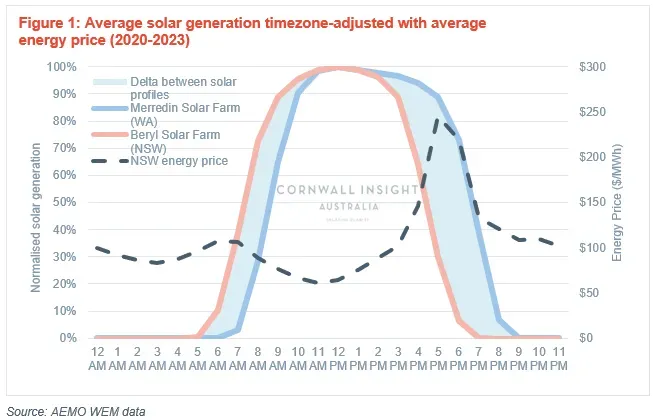
This topic of energy transfer across timezones is the basis for this Chart of the week, particularly how the NEM could benefit from a greater diversity of solar-generating windows. The most strategic location would be in Western Australia. Unlike the Australia-Asia PowerLink, this West-to-East flow, as shown in Figure 1, would allow generation from WA solar to flow through to the NEM as demand rises to the daily afternoon peak, and thus the captured solar price would be much higher than you would typically see for solar.

With a West-East interconnector built combined with large-scale solar farms, downward pressure would be applied to afternoon peak prices across the NEM. However, this downward pressure would occur through most of the Eastern state’s solar generating period, thus lowering their captured solar even further. Resulting in WA still capturing a higher solar price.
To be able to take advantage of this overlap of solar generation and demand, our National electricity market would have to truly become national, which means connecting the WEM to the NEM with a 2,000-2,400km HVDC transmission line. Joining Western Australia with South Australia through this interconnector would allow distribution to the rest of the NEM. By 2025 SA-NSW Energy-Connect will have been completed, greatly relieving South Australia’s current exporting/importing limitations (Energy-Connect).
A full breakdown of the cost-benefit analysis of this transmission project is outside the scope of this article however, a few points quickly would be.
+ Increase reliability in a green grid due to further diversification of weather patterns.
+ Strengthen WA and SA exporting and importing abilities.
+ Solar generation profile delta between Western Australia and Eastern states.
+ Benefits to the economy from job creation.
– Interconnector construction and maintenance costs, a significant portion in remote locations leading to above-average costs and longer turnaround times when issues occur.
– Interconnector losses, although UHVDC technology may mitigate these losses.
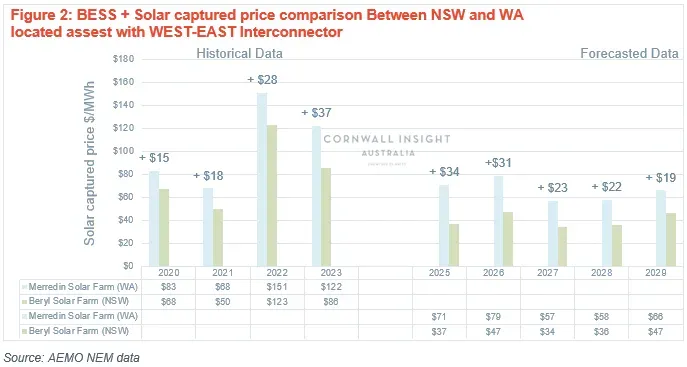
We have used Cornwall Insight Australia’s Storage Investment Model (SIM) to demonstrate the potential revenues from diversified solar generation windows to simulate this scenario. It can be observed in Figure 2 how much of an increase in the captured solar price could be expected with a West-East interconnector in place.

On the left-hand side of Figure 2, inputting historical data to our SIM, a solar + BESS asset has a captured solar average price of $108/MWh in WA compared to $80/MWh in NSW. The right-hand side of Figure 2 uses Cornwall Insight Australia’s latest NEM Benchmark Power Curve (BPC), allowing the SIM to use forecasted prices, resulting in an average price of $66/MWh in WA compared to $40/MWh in NSW.
Cornwall Insight Australia investigates a range of scenarios using our Storage Investment Models that provide in-depth revenue forecasting and optimisation services. In addition, we have NEM market models based on market-validated assumptions and sound power systems principles. For more information on the energy market and power systems modelling or other bespoke consultancy products, please contact enquiries@cornwall-insight.com.au.
Appendix:
- Energy could also flow from east to west in morning periods when eastern states have excess solar and WA is reaching its morning peak demand
- Generation profiles averaged from 01/01/2020 to 01/07/2023
- HVDC cables have around 50% of the losses of AC, approximately 3.5% per 1,000 km. With UHVDC losses even lower.
- BESS + Solar specs:
- MLF, DLF=1
- RTE=.922
- Maximum cycles per day =1


