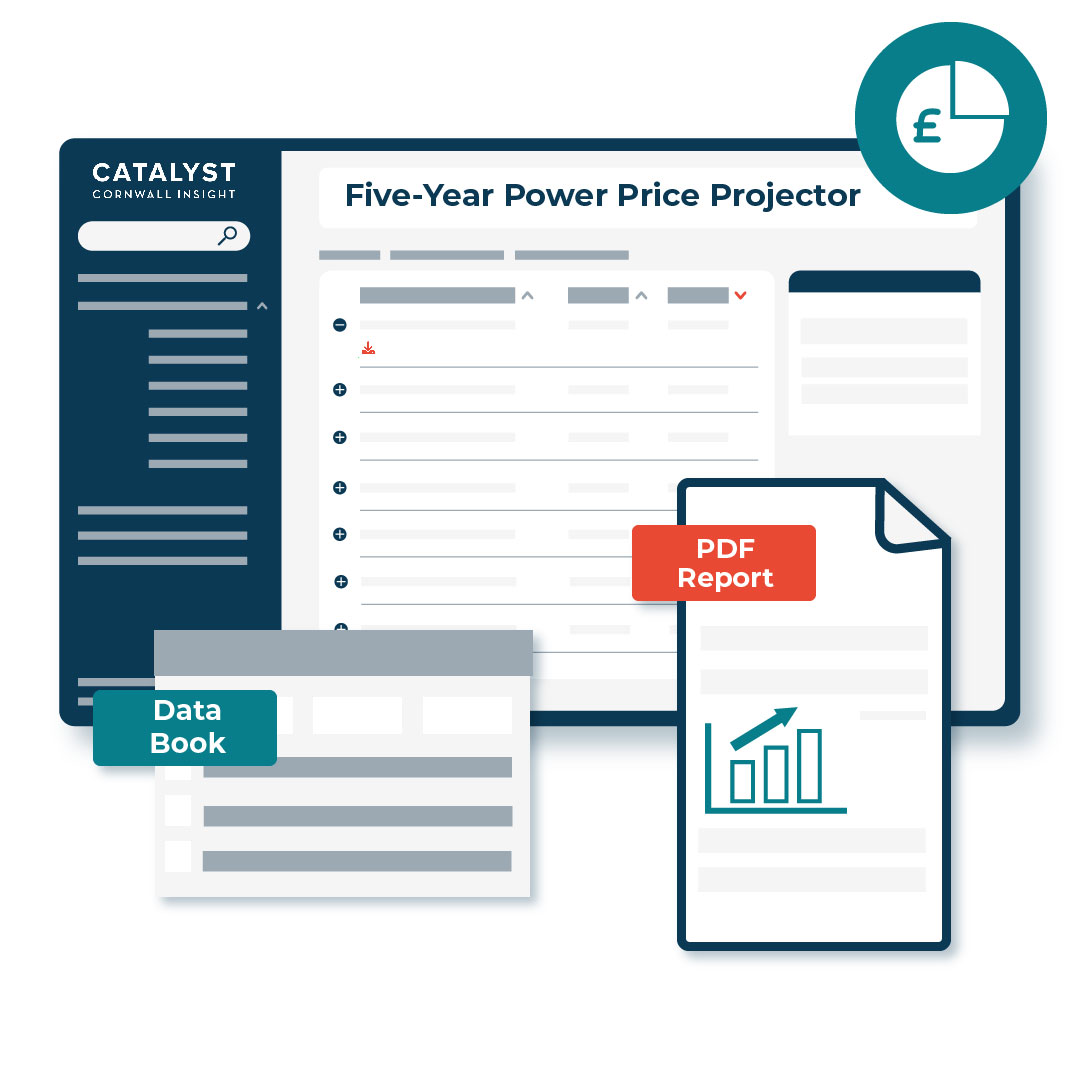
5 Year Power Price Projector (GB)
Understand the trajectory of power prices beyond the horizon of the forward curve and integrate these assumptions into budgeting, trading, and business decisions.
A quarterly report is issued with an accompanying excel workbook to cover key data on market fundamentals, gas and carbon market forecasts. The 5-year power price projector provides the same level of exceptional quality and insight given in our long-term ‘Benchmark power curve service’, but over a shorter timescale specifically designed for organisations looking to assess activity in the coming years.
The forward curve presents a 5-year scenario-based projection of electricity price outcomes. The curve forecasts three scenarios (high, medium, low), based on National Grid’s Future Energy scenarios and which are based on variability in the market – things like volatility, renewable deployment, regulatory and policy change etc. The model uses Plexos software and provides a generation weighted capture price forecast for technologies including offshore/onshore wind, solar, CCGT, OCGT, tidal, pumped hydro, battery storage etc, as well as baseload and demand. It also covers associated natural gas, coal and carbon price forecasts, and the forecast goes down to a monthly granularity.
What's included in the 5 Year Power Price Projector (GB) service?
- A quarterly report
- Accompanying databook which underpins the model
- Bespoke market commentary and analysis
Who is this service for?
What are the benefits of this service?
- An independent view on your own company assumptions, trusted by the market and built around our long-term modelling assumptions and expert views on power market developments.
- Easily digestible report and usable workbook allows you to utilise our forecasts directly in business planning and b-budgeting activities.
- Regular updates to our projections allow you to assess the impacts of policy and regulatory change, commodity price movements and supply and demand fundamentals on the 5-year outlook for power and commodity prices.

Fill in your details and we will get back to you as soon as possible with more information about our 5 Year Power Price Projector service

Tom Ross
Senior Business Development Manager
Get in touch using the form to request a sample


