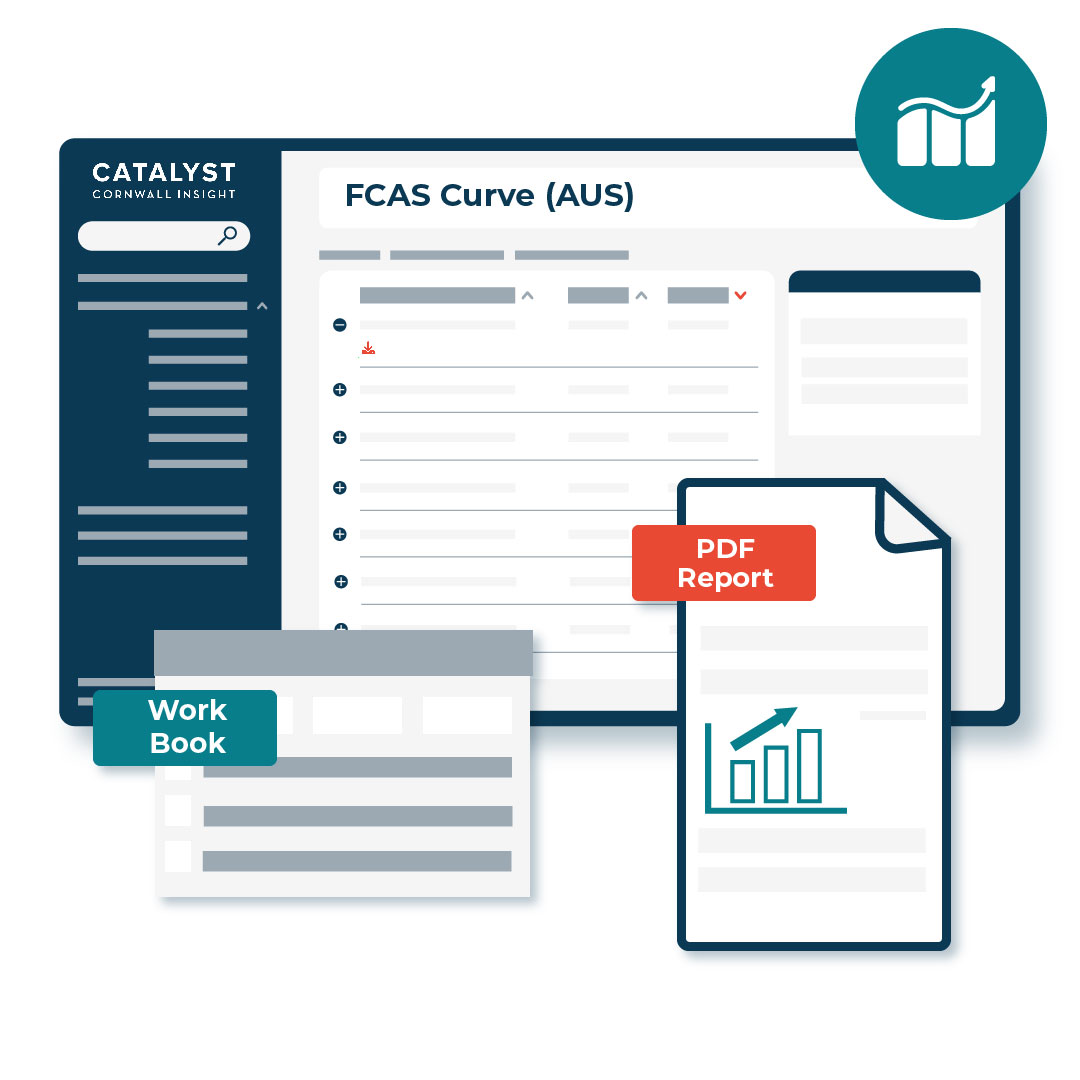
FCAS Curve (AUS)
A granular 30-minute price forecast for all NEM ancillary service markets (all 10 FCAS markets) over a 20-year horizon.
The NEM FCAS market curve is co-optimised with our NEM Benchmark power curve to ensure dispatch and pricing outcomes are aligned with actual energy market portfolios and strategies. Our innovative forecasting model utilises a statistical bid-based approach at the generating unit level across all markets and technology types. The report accompanying the modelled pricing includes a review and analysis of pricing drivers, changes in enabled capacity, and policy and regulatory shifts (including new markets).
If you would like a summary of the main headlines from our most recent FCAS report, please fill in this short form.
What's included in the FCAS Curve (AUS) service?
- 20-year price forecasts of all 10 NEM FCAS markets at a 30-minute dispatch resolution
- Quarterly report and webinar detailing the results
- Breakdowns of each FCAS markets requirement levels
- Examination of the technologies participating in each market and how the mix will shift over time
- Diurnal (time-of-day) view of the dynamics of each FCAS market
Also included is The Australian Bulletin, which offers regular updates on market movements, pricing trends, and forecasts, as well as insight into regulatory changes and their potential impact on market participants. The Bulletin also looks at industry structure, including key commercial announcements and developments shaping the energy transition. The Australian Bulletin is a standard inclusion for all our subscription service customers.
Who is this service for?
What are the benefits of this service?
- Policymakers at all levels can use our FCAS curves to evaluate and review the forward FCAS markets, assisting them in understanding the market signals and potential requirements for new market design or government investment.
- The dataset is provided in a usable format, facilitating easy integration with financial models and allowing for detailed volatility reviews and assessment of forward opportunities.

Fill in your details and we will get back to you as soon as possible with more information about our FCAS Curve (AUS) service

Stefano Boscaglia
Sales and Regional Lead (Australia)
Get in touch using the form to book a demo


