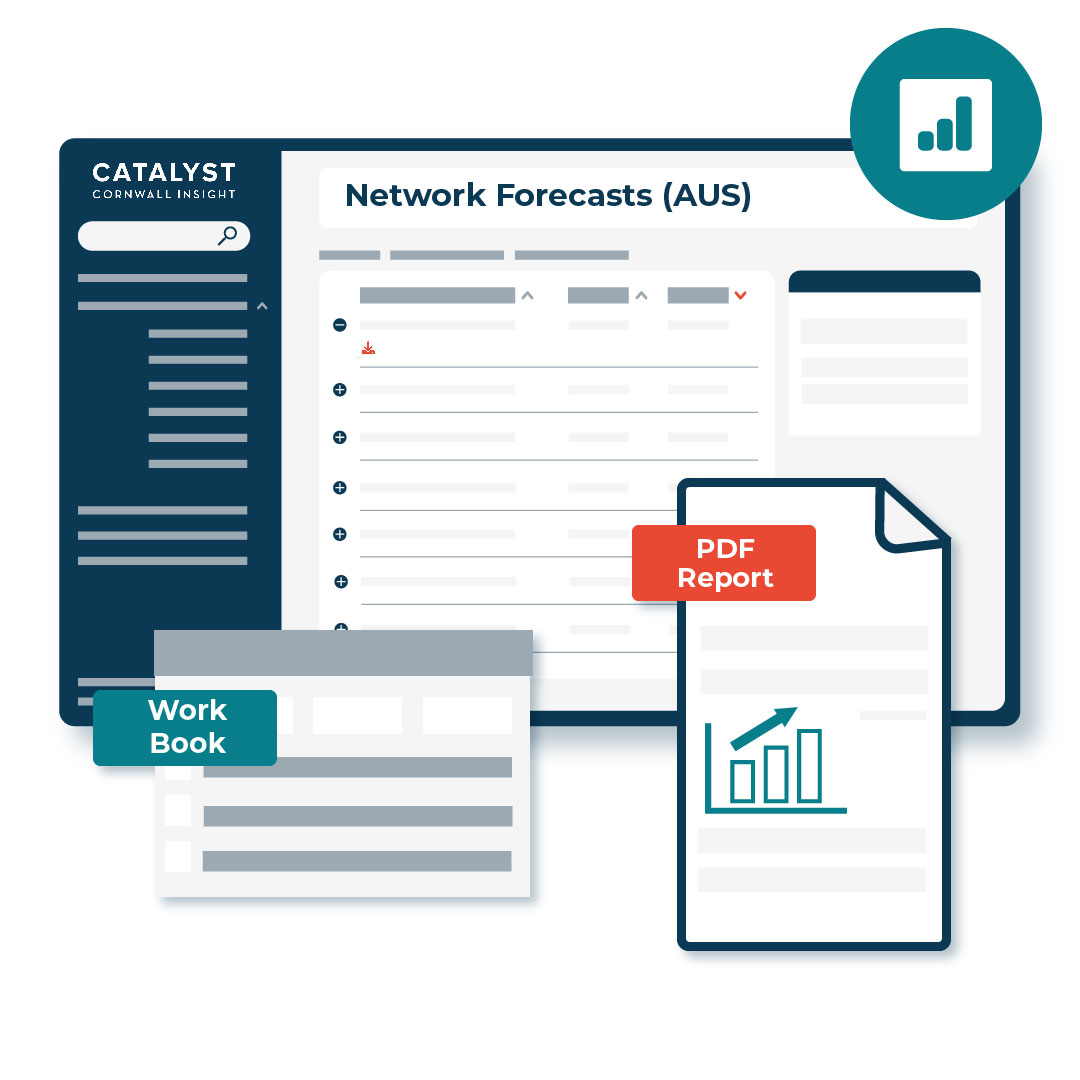
Network Forecasts (AUS)
Included in this service is our Marginal Loss Factor (MLF) Curve.
The MLF Curve includes projections for all current generators in the NEM and selected TNI points in Renewable Energy Zones (i.e., sub-regional REZ locations).
Our MLF model utilises the 30-minute unit-level dispatch profile from our Benchmark Power Curve. This ensures that the load flow aligns with our price forecast assumptions, giving our clients confidence in the configuration of assumptions and outcomes of our MLF and price projections.
What's included in the Network Forecasts (AUS) service?
- MLF annual forecast data by state, REZ, and individual generator DUID in an easy-to-use databook.
- Accompanying report analysing drivers for changes in MLFs by state as well as deep analysis on specific REZs
- Price and load flow model alignment means that all our forecasts are based on the same foundational modelling
Also included is The Australian Bulletin, which offers regular updates on market movements, pricing trends, and forecasts, as well as insight into regulatory changes and their potential impact on market participants. The Bulletin also looks at industry structure, including key commercial announcements and developments shaping the energy transition. The Australian Bulletin is a standard inclusion for all our subscription service customers.
Who is this service for?
What are the benefits of this service?
- Transparent service provides clients with as much information as possible to make informed decisions
- Aligned economic and load flow modelling assumptions
- MLF projections include both current and future REZ projections by technology type

Fill in your details and we will get back to you as soon as possible with more information about our Network Forecasts (AUS) service

Stefano Boscaglia
Sales and Regional Lead (Australia)
Get in touch using the form to book a demo


